Crysis Level -
http://www.mediafire.com/?zd1yw2wb9uwu7n2
Objects File -
http://www.mediafire.com/?8970dp23dqt79rd
Skectup File -
http://www.mediafire.com/?atd1klpx1q4sd5y
Thursday, 10 November 2011
EXPERIMENT 2 - Final Submission
ABSTRACT
My final Analytics Engine will come in a form of 3 influential categories which are; Windmill - Sustainable Energy, Scale - Environment and the Dwelling.
I have chosen these categories as they can be used to feed any raw data influenced by the current environmental factors effecting the world. Each platform enables a user to determine raw data in an interesting real time environment and demonstrates the benefits of visual representations of data.
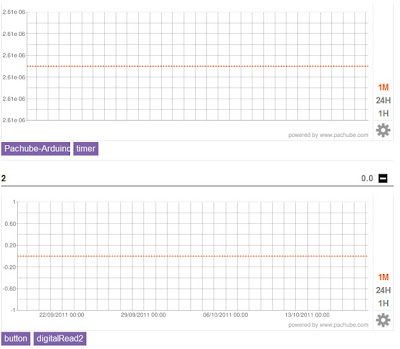
*Please note due to pachube feed being frozen I have taken the xml data and manipulated it for effectiveness.
Structure of Engine
- Satelite - Live feed from pachube will enter the satellite situated above and a laser conduit will be seen as the first sign in activating the analytics engine.
- Main Platform - generator underneath will transform the data and feed it through each staging arena.
FINAL VIDEO OUTPUT
Tutorial Video and 500 words
TUTORIAL: Glow entity based on XML input
My chosen tutorial will be based on 'glowing entity triggered by data taken from an XML document'.
From my experience there is one lesson on changing material parameters in Crysis, created by Vinh in his step ladder tutorial. The one I have created will expand on those ideas and help those up and coming students or enthusiasts to apply this strategy in a number of ways.
Linking from my experience in Experiment 1 and 2 would involve a combination of changing material glow or opacity with the use of a Boolean node, activating its corresponding material based on a true or false value. Inadvertently, this unique strategy was heavily used for my main concept in Experiment 1 and succeeded in providing an informative visual installment. In Experiment 2, we delve further into the flowgraph technique in utilizing an external live feed from the web and transforming its raw data into an interactive visual display. So I thought why not combine the two?
 |
| Image - Material Editor with corresponding parameters |
As you can see from the image above, the parameters that set each entity can be manipulated in a number of ways. Whether increasing glow, changing its shader, opacity, or diffuse colour, or even its material has a major advantage in a much larger and diverse application.
The format in introducing this change will amalgamate a node called String:SetString...see below image.
The example image above depicts values entering a Boolean node Math:less, either true or false output with the connecting action to trigger the node String:SetString. In each of the string node lies the edited material.
In conclusion, I believe this technique is unique and has a number of advantages in applying to various possibilities within Crysis Sanbox2......I have showed you only one in this tutorial.
WK 4 - 3 X 30 second clips of Flowgraph Analysis
I wanted to illustrate 3 distinct and different visualisations of raw data allowing anyone to understand it in three different perspectives.
PART1 - Sustainable Energy
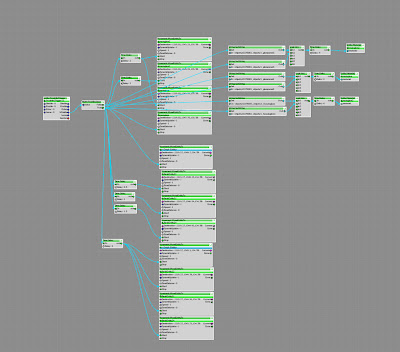
In this part of the analysis i wanted to depict speed of rotation dependent on numerical values.....the higher the value the faster the rotation and vise verse. See images of flowgraph below for further information.
 |
| Full Windmill flowgraph - xml nodes taken from pachube enters at intervals into logic-Demultiplexer and spits them out to the corresponding entity via its rotate trigger. |
 |
| Closeup of windmill nodes |
PART 2 - The Environment
Initially I wanted to use MoveEntityTo node based on the z axis but had a minor altercation with sandbox not agreeing with me, so I have left it to scale at z axis instead. I think it would be beneficial to understand for those who have no crysis background or experience.
 |
| Closeup Flowgralph of Scale Entity. |
PART 3 - The Dwelling
This part of the installation links in with the SWOT Analysis of my chosen pachube feed. The analysis utilises an automatic rotating roof that opens and close dependent on values, and subsequent glow (natural light) and artificial lights to reflect.
Tuesday, 8 November 2011
Added Research
I found this video showing the benefits of utilising infographics in a presentation. The video captures the essence of infographics in displaying raw data in a way anyone can understand. Their format is effective with the use of bright colours, animated in sequence of delivery to educate the viewer and possibly solicit a response.
Monday, 7 November 2011
WK3 - Infographics and Brief of Analytics Engine
Brief
1. Developing Link.
My understanding with linking the chosen pachube feed with the flowgraph technique previously done would probably look into introducing xml live feeds that is saved within the mods folder, and then imported into a custom analytics engine in crysis that would translate it into a real-time visual representation in a form of scenarios or effects.
2. Analytics Engine Brief.
My idea in creating an analytics engine to visualize raw data will come in the form of 2/3 indicators. These are light (natural & artificial) and a dwelling incorporating an automated roof that opens and close dependent on the requirement of the sun's light. The dwelling will also be sectioned cut for viewer demonstration and visualization effect.
Breakdown of strategy:
- Crysis Level - I will be developing a level that is dark in texture and at night. This will allow a more flexible delivery of light to be introduced into the spectrum.
- Arena - A stationed platform hovering above a lake will be the base of the representation of my analytic s engine. Three indicators will lie adjacent to one another.
- Avatar - When local player is in game there will be a separate platform intermittently illuminated in the distance encouraging the avatar to enter its platform. Once entered, a trigger will initiate a series of light shows transiting to the stationed platform finally activating the analytics engine.
Thursday, 29 September 2011
WK2 - XML Flowgraph
Video below will show the Flowgraph for WK2 in action. It clearly demonstrates how the flowgraph can capture distance traveled between local player and the entity, and integrating xml document to open and save the total distance traveled with a press of a button.
Flowgraph Images:
Close up images:
Flowgraph Images:
Close up images:
EXP2_WK1 - Independent Study - SWOT Analysis
Pachube feed by DuYuan Arch1391.
Conceptual Idea:
'My idea is to model the development of a ardunio switch control, which can control the interior LED lights on and off, and can be controlled with a switch of the roof, the roof will also turn off all the LED lights for this.'
SWOT ANALYSIS
Saturday, 10 September 2011
FILE LINKS
Sketchup:
http://sketchup.google.com/3dwarehouse/details?mid=2c1b8234a5f98e771f26dd2b346c3b4e
Crysis Level:
Objects
http://www.mediafire.com/?cplw1joutyuisr5
Levels
http://www.mediafire.com/?d5fqsnmnrrah4xi
http://sketchup.google.com/3dwarehouse/details?mid=2c1b8234a5f98e771f26dd2b346c3b4e
Crysis Level:
Objects
http://www.mediafire.com/?cplw1joutyuisr5
Levels
http://www.mediafire.com/?d5fqsnmnrrah4xi
FINAL Machinima Documentary
Credits:
- Medium -
Crysis Sandbox2
- Music -
Life in Technicolour - Coldplay
- Movie Intro -
Bubbles - http://www.ignitemotion.com/video_background/Bubbles_Animation/4a0Pbx0_BBA
Flow - http://www.ignitemotion.com/video_background/Flow_Animation/zf3cvLjPtus
- Video Editing -
Sony Vagas
Any Video Converter
Other flowgraphs used:
 |
| Image Captures |
 |
| Lights Triggered by TimeofDay |
 |
| Roof Movement with Opacity |
Wednesday, 7 September 2011
WK 5 Output - Modes and Machinima Test
Mode:
Observational documentary will be used for this installation which serves to illustrate an unobtrusive delivery of images capturing natural behaviour of the avatar and interactions with his environment. The focus of this documentary is to exhibit possible solutions arising from this type of phobia and pushing the boundaries of the typical norm, allowing the viewer to be involved within the ongoing process.
 |
| Moving facade succeeding with opacity of walls |
 |
| Sketchup Components and Perspective Images |
Saturday, 3 September 2011
Wk4 Independent Study Outputs - Installation Progress
The engagement of 'Pure War' will be centered on 2 main inherent Phobias an individual may experience in their life, and explores the conditions and/or probable solutions one may pursue to overcome that fear. The link to the Pachube feed will also be evident in one of the phobia's whereby a dwelling created with sketchup and flowgraph techniques captures the notion of the built form protecting the occupant within while repressing the symptoms of that phobia.
Installation 1
Lygophobia - Fear of dark spaces and places.
The setting for this installation encompasses a high tech home of an individual with this particular phobia.
The Dwelling built to be self aware if someone is at home, utilises high tech sensors to reconfigure the space around him/her effectively quelling the symptoms of Lygophobia which are anxiety and depression.
- above video illustrates the facade wall opening up when it senses close presence of the player.
- Flowgraph used;
 |
| Garage |
 |
| Verandah |
Installation 2
Autophobia - Fear of loneliness, of being alone.
The setting for this installation will involve the perseverance of interaction with other AI's on the notion that to combat loneliness, one needs to combat the fear of interaction and rejection.
Local player will be introduced walking around and trying to make contact with individuals and groups but fails to be acknowledged and only gets the cold shoulder from other Ai's......eventually with determination the significant other is found. Material-param will be used here to signify the significant other.
- above video will illustrate the second phobia of interaction with other Ai's.
- Flowgraph used;
 |
| Ai ignores looking at avatarwith proximity trigger |
 |
| Ai ignores avatar and walks to randomly selected tag points |
 |
| Ai ignores avatar, get in car and follow path |
Wednesday, 10 August 2011
WK 3 - TASK
Outline on task completed via video blog;
- Animate the time of Day
- Scale an object
- Reading XML files flowgraph
- Creating Rain
Tuesday, 9 August 2011
WK 2 - Independent Study - Paul Virilio's concept of "Pure War!"
Monday, 25 July 2011
Independent Study - WK1
FEED - Home Monitoring
Link: http://pachube.com/feeds/8483State of the art security/management system that is virtually self aware and reliant with the benefit of control through the internet, mobile and IR capabilities.
This system effectively performs checks with its high tech sensors to turn on lights when it senses movement, audio equipment, AC/Heating if its too cold or hot and even open up curtains where outside light is required. Another great aspect is it allows you to monitor your home via internet and server links that keep you up-to-date.
This revolutionary concept can pave the way for technologically advanced homes that takes care of its occupants and itself rather than the other way around.
Subscribe to:
Comments (Atom)


